
What close rate should a roofer expect from online leads?
- What's a realistic close rate on roofing leads from Google, ads and your website?
- What close rate do roofers get on estimates?
- What close rate should I expect from online leads specifically?
- Why do referrals close so much better than online leads?
- Should I measure close rate per lead or per estimate?
- Is a 20% close rate good for roofing leads?
- How many signed jobs should I expect from 100 roofing leads?
- What drags down the close rate on online roofing leads?
- Does insurance and storm work change the close rate I should expect?
- How long should I wait before calculating a month's close rate?
- Is a very high close rate always good news?
- What's different about close rates for roofing companies
- A worked example: from 100 online leads to signed roofs
- Frequently asked questions
- Key takeaways
- More in this section
- Sources
The short version
- Homeowners usually compare about three roofers, so signing about a third of your estimates is roughly average.
- In one software vendor's 2026 figures, online leads close below referrals, and shared lead-service leads close lowest.
- Lead-to-signed is always lower than estimate-to-signed, so know which one you're looking at.
- Slow callbacks, unwanted leads, price-first marketing, a thin presentation and missing follow-up drag the rate down.
For roofing owners trying to tell whether their online leads, or their sales process, are the reason too few estimates turn into signed roofs.
Get a free visibility audit · Book a growth call
What's a realistic close rate on roofing leads from Google, ads and your website?
There’s no audited close rate for roofing, so treat any figure you hear as a rough guide, not a benchmark. Homeowners usually compare about three roofers, which is why Roofing Contractor magazine’s 2006 homeowner survey called signing about one in three estimates average, and its 2026 survey shows the three-quote habit hasn’t changed. Counted from first contact to signed contract, online leads close lower than that, because some never book an inspection, and they generally close below referrals, so the number that matters most is your own rate by lead source compared with last quarter.
Close rate is where marketing and sales meet, and it’s the number we look at before recommending more ad spend. Call tracking, source tagging and a monthly cost-per-lead breakdown come with every one of our roofing marketing packages, and automation add-ons, such as automated follow-up and after-hours answering, help with the response and follow-up side. For the channels that bring the leads in, roofing lead generation covers each one, and the rest of the roofing marketing questions library goes question by question.
What close rate do roofers get on estimates?
The longest-running reference point comes from Roofing Contractor magazine. In its consumer survey of homeowners who had bought a replacement roof, homeowners called three roofing contractors on average, and the magazine concluded that a national close rate of 33% means you’re doing about average (Roofing Contractor’s Consumer Survey). That survey was mailed to 1,300 property owners in late 2006, so it’s old. The logic still holds, though: if a homeowner collects three bids and picks one, an average roofer wins about one in three.
The magazine’s 2026 homeowner survey suggests the three-bid habit hasn’t changed. Asked how many quotes they’d gather, 66% of homeowners said three, 27% said they’d seek multiple quotes, and only 1% said they’d accept a single quote (The Homeowner’s Roofing Journey in 2026).
Roofr, a roofing software company, says in a 2026 blog post that many roofing shops aim for somewhere between 30 and 50 percent on qualified leads (7 Roofing Sales Metrics). All of these describe estimates or qualified leads, not every inquiry that reaches you.
What close rate should I expect from online leads specifically?
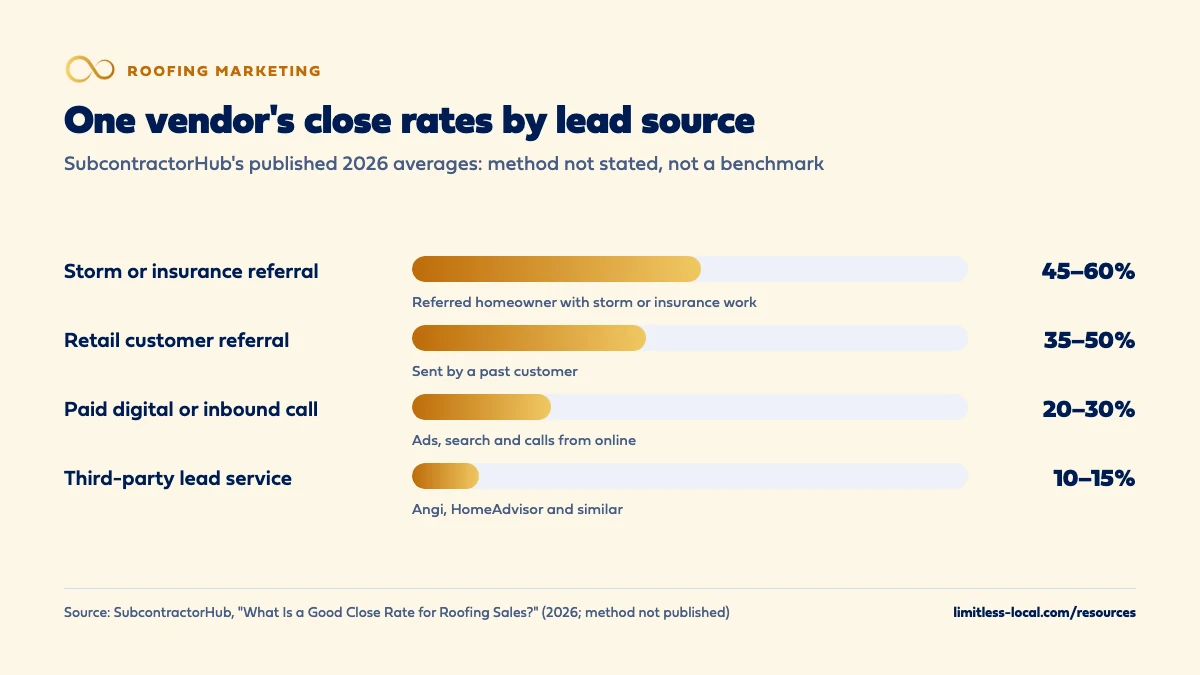
Close rates broken out by lead source are harder to find, because few companies publish them. SubcontractorHub, a company that sells sales software to roofers and other home-improvement contractors, lists these 2026 average close rates by lead source (What Is a Good Close Rate for Roofing Sales?):
- Storm or insurance restoration referral: 45–60%
- Retail customer referral: 35–50%
- Paid digital or inbound call: 20–30%
- Third-party leads (Angi, HomeAdvisor and similar): 10–15%
Read those with care. The article doesn’t say how the figures were gathered or exactly what was counted as a close, and it comes from a company that sells sales tools. What makes the list useful is the order, not the exact percentages: a homeowner a past customer sent to you closes far more often than one who found you through an ad, and a lead sold to several roofers at once closes least of all.
Split your own online number by channel, too. In our judgement, a homeowner who calls from your Google Business Profile after reading your reviews behaves more like a warm lead than a form on a lead site that went to four other roofers.
Why do referrals close so much better than online leads?
Because trust arrives with the referral. Roofing Contractor‘s consumer survey found that friends, neighbors and relatives were the source of 75% of the leads homeowners used, and that those recommendations got the contractor hired half the time. When the magazine compared how likely each source was to turn into a contract, relatives came out as the most effective source and friends next (Roofing Contractor’s Consumer Survey).
The 2026 survey points the same way. Asked how they find a roofer, 74% of homeowners said they follow a recommendation from a neighbor, friend or family member, while exactly half said they use search engines. And 62% said online reviews were very or extremely important in their decision (The Homeowner’s Roofing Journey in 2026).
An online lead starts from zero: the homeowner found you an hour ago, likely alongside two other roofers, and nobody is vouching for you. In our judgement, that’s the main reason online leads close lower, and why reviews, photos of nearby jobs and a fast callback matter more for them than for any other source.
Should I measure close rate per lead or per estimate?
Both, and never mix them. A roofing lead passes through several stages before anyone signs: first contact, an inspection on the calendar, the inspection itself, an estimate, then a signature, sometimes with an adjuster’s visit in between. Each step loses some people, so the rate depends on which stage you divide by.
- Lead-to-signed: signed contracts divided by real leads. This is what your marketing actually produced.
- Lead-to-inspection: inspections booked divided by leads. Roofr calls this the lead-to-appointment rate, and notes that a strong close rate with a weak lead-to-appointment rate means leads are dying before anyone gets in front of them.
- Estimate-to-signed: signed contracts divided by estimates given. Most published close rates, including the one-in-three figure, describe this one, and it mostly reflects your sales process.
When anyone quotes you a close rate, ask which one it is. And decide what counts as a lead before you divide. Spam, wrong numbers, vendors and homeowners outside your area don’t belong in the bottom of the fraction. Tracking which leads turn into signed jobs covers how to set those definitions and stages up.
Curious what your marketing is actually booking?
Get a free visibility audit — no obligation, no sales pitch.
Is a 20% close rate good for roofing leads?
It depends on what the 20% is measured against.
- 20% of estimates signed is well below the one in three you’d expect when homeowners compare about three roofers. In our judgement, that points at the sales side: what happens at the inspection, how the estimate is presented, and whether anyone follows up.
- 20% of all real online leads signed, counted from first contact, is in our judgement a respectable result, because it already absorbs the homeowners who never booked an inspection and the ones who went quiet. The benchmarks above don’t say which denominator they use, so compare loosely.
- 20% of shared third-party leads signed would be above the 10–15% average SubcontractorHub lists for that source.
Whatever the number, the comparison that tells you most is your own rate for the same source last quarter. If it’s falling while lead volume rises, you’re probably buying more of the wrong leads.
How many signed jobs should I expect from 100 roofing leads?
There’s no honest single number; it’s the product of your own stage rates. Multiply the share of leads that are real, the share that book an inspection, the share that get an estimate and the share of estimates that sign, and you have signed jobs per 100 leads. The weakest stage shows the leak: a low inspection rate usually means phones and response, a low estimate close rate means sales or follow-up, and a pile of junk means targeting. The worked example below runs the math, and once you know your rate, the cost per booked job to aim for turns it into a budget question.
What drags down the close rate on online roofing leads?
In our judgement, five things account for most of it:
- Slow response. In the 2026 survey, 39% of homeowners expected to hear from a roofer the same day and 56% within one to two days, and 58% expected a visit within one or two days (Roofing Contractor). A homeowner who has contacted three roofers tends to meet whoever shows up first. How fast to call back a new lead sets a standard.
- Leads you can’t or don’t want to serve. Out-of-area calls, job types you don’t do and renters inflate the bottom of the fraction. With Local Services Ads, Google no longer gives credits for leads about job types you don’t service or areas you don’t serve, and it suggests revisiting your service areas, job types and categories if you’re getting unwanted leads (About Automated Local Services Ads lead credits).
- Price-only shoppers. Shared leads and price-first ads attract homeowners whose only rule is the lowest bid. Stopping price shoppers before they call covers the ads and website side.
- A thin presentation. In Roofing Contractor‘s consumer survey, the contractor who won the job shared a manufacturer certification 77% of the time, against 34% for the typical contractor, and offered an enhanced warranty 71% of the time, against 30% for the typical contractor. In 2026, 46% of homeowners said the choice between two roofers comes down to proven experience and roofing-specific certifications.
- No follow-up on open estimates. Many estimates go cold rather than lose to a competitor. Following up on unsigned estimates gives a schedule.
Does insurance and storm work change the close rate I should expect?
Yes. The highest average in SubcontractorHub’s list was storm or insurance restoration referrals, at 45–60%. In our judgement, insurance work also runs on a different clock: the decision often waits on the adjuster, so a storm-season estimate may sign weeks later, or not at all if the claim goes the wrong way for the homeowner. The claim itself is between the homeowner and their insurer; your job is to track the lead.
Tag every lead retail or insurance and calculate a close rate for each. Blended, a hailstorm can make a weak retail month look fine. If you run Local Services Ads for roofing, track those leads as their own source too, because who they reach changes with the weather.
How long should I wait before calculating a month's close rate?
Longer than feels natural. Roofs often sign weeks after the inspection, so a month’s close rate keeps climbing after the month ends. Count estimates by the month they were given (or leads by the month they arrived), then count how many of those signed, whenever they signed. Look at each month again a month or two later before judging it.
Know how your software counts. Jobber’s quotes report compares quotes sent in a month with quotes converted in a month, and notes the rate can come out above 100% because quotes can be converted without being marked sent. For a cleaner number, Jobber explains how to export the report and divide the quotes with a converted date by the total quotes in the period (Quotes Report).
Small numbers swing hard: with two dozen estimates in a month, each signature moves the rate about four points. Decide on a rolling quarter.
Is a very high close rate always good news?
Not always. In Roofing Contractor‘s consumer survey, the median lowest bid homeowners received was $6,300, the median highest was $9,000 and the median they actually paid was $7,600, which the magazine read as homeowners typically passing on a quote 17% lower than what they paid. The prices are from 2006, but in our judgement the pattern still holds: many homeowners don’t take the cheapest bid when they see why one roofer is worth more.
In our judgement, if almost every estimate you give signs, check three things. Your prices may be lower than your market would pay. Your lead mix may be mostly referrals, so the rate looks great while your marketing brings in few new buyers. Or only the serious-looking estimates are getting logged. Watch the close rate next to your average signed ticket: a rate that rises while the ticket falls usually means discounting, not better selling.
Want to see where your company stands?
A free visibility audit shows where you show up on Google, Maps and AI answers, and what it's costing you in calls.
What's different about close rates for roofing companies
The inspection sits in the middle. In many service trades the first call books the job. In roofing it books an inspection, and the estimate and the signature come later, so there are more places for a lead to fall out and more than one rate worth watching.
Storms change the mix overnight. After hail or high wind, lead volume, the share of insurance work and the share of out-of-area chasers all move at once. A close rate measured across a storm month says little about a normal one.
Repairs and replacements close differently. A repair quote and a full replacement estimate are different decisions for the homeowner. Track them apart, or a run of small repairs will hide how your replacement estimates are really doing.
A worked example: from 100 online leads to signed roofs
These numbers are made up to show the math, not a benchmark for your market. Say a month of Google Ads, Local Services Ads and website forms brings in 100 leads, and the ads cost $4,200. After you remove spam, wrong numbers and out-of-area calls, 80 are real. Of those, 48 book an inspection, 40 get an estimate, and 14 sign.
- Estimate close rate: 14 divided by 40 is 35%.
- Lead-to-signed rate: 14 divided by 80 real leads is 17.5%.
- Ad cost per signed roof: $4,200 divided by 14 is $300.
Now say a steadier follow-up routine gets 16 of the same 40 estimates signed. The estimate close rate rises to 40%, and the ad cost per signed roof falls to about $263, with the same spend and the same leads. That’s why we look at close rate before recommending a bigger ad budget: raising spend into a weak close rate buys more estimates that don’t sign.
Every one of our packages includes call tracking, source tagging and a monthly cost-per-lead breakdown; add the signatures from your job software and you have cost per signed job by source.
Frequently asked questions
What's the difference between close rate and booking rate?
Booking rate is the share of leads or calls that turn into a booked inspection. Close rate is the share of estimates, or of all leads, that turn into signed contracts. A low booking rate usually points at the phones and response time; a low close rate after the inspection usually points at the sales process or follow-up.
Do Local Services Ads leads close better than Google Ads leads?
We haven’t found a published source that compares them for roofing that we’d trust. Track each as its own lead source and compare your own close rates after a quarter of data.
Will offering financing raise my close rate?
It can help. Roofing Contractor‘s consumer survey article lists offering financing among the ways a roofer can stand apart. If you advertise specific payment terms, use the wording your financing provider approves.
Can a marketing agency promise me a close rate?
No, and be wary of one that does. Close rate depends on your response time, your inspection and your follow-up as much as on the leads. We don’t guarantee lead counts or revenue; what we promise is that you’ll see what each source produced.
Why is my close rate up but revenue flat?
Usually because the mix changed: more small repairs and fewer replacements, or more discounting to get signatures. Look at close rate next to average signed ticket, and split repairs from replacements.
Key takeaways
- Homeowners usually compare about three roofers, so signing about a third of estimates is roughly average.
- Online leads close below referrals and above shared lead-service leads; judge each source on its own.
- Lead-to-signed and estimate-to-signed are different numbers; always say which one you mean.
- Slow callbacks, unwanted leads, price-first marketing, a thin presentation and missing follow-up are the usual drags.
- Count by the month the estimate or lead came in, and give roofs time to sign before judging a month.
Not sure what's working right now?
Start with a free visibility audit: rankings, Google profile, reviews and tracking, checked against your service area.
More in this section
- How fast should a roofing company call back a new lead?
- Is door knocking or online marketing better for a roofing company?
- What should a roofing website include to get more estimate requests?
- Do Facebook ads work for getting roofing leads?
- How many new Google reviews a month should a roofer get?
Sources
- Roofing Contractor's Consumer Survey — Roofing Contractor
- The Homeowner's Roofing Journey in 2026 — Roofing Contractor
- 7 Roofing Sales Metrics Every Contractor Should Track in 2026 — Roofr
- What Is a Good Close Rate for Roofing Sales? (2026 Benchmarks) — SubcontractorHub
- Quotes Report — Jobber Help Center
- About Automated Local Services Ads lead credits — Google Local Services Help