
Which numbers should an HVAC owner track every week?

- What belongs on an HVAC owner's weekly scorecard, and how do I read it?
- Why check numbers every week instead of every month?
- Number 1: How many real leads came in, and from where?
- Number 2: How many calls did we miss?
- Number 3: What share of real leads booked?
- Number 4: How many estimates did we run, and how many sold?
- Number 5: What did we spend, and what did each booked job cost?
- Number 6: How much revenue did each source bring in?
- Number 7: How full is next week's schedule?
- How do I set up a one-page weekly scorecard?
- How do I read the numbers without overreacting?
- Which numbers can wait for the monthly review?
- What's different about tracking numbers for an HVAC company
- A worked example: two weeks on one scorecard
- Frequently asked questions
- Key takeaways
- More in this section
- Sources
The short version
- Track real leads by source, missed calls and booking rate.
- Add estimates run and sold, spend and cost per booked job.
- Finish with revenue by source and next week's schedule.
- Read them in order and fix the first number that drops.
For HVAC owners who want a short weekly check on marketing and the office, not a giant report, and want to know what each number is telling them.
Get a free visibility audit · Book a growth call
What belongs on an HVAC owner's weekly scorecard, and how do I read it?
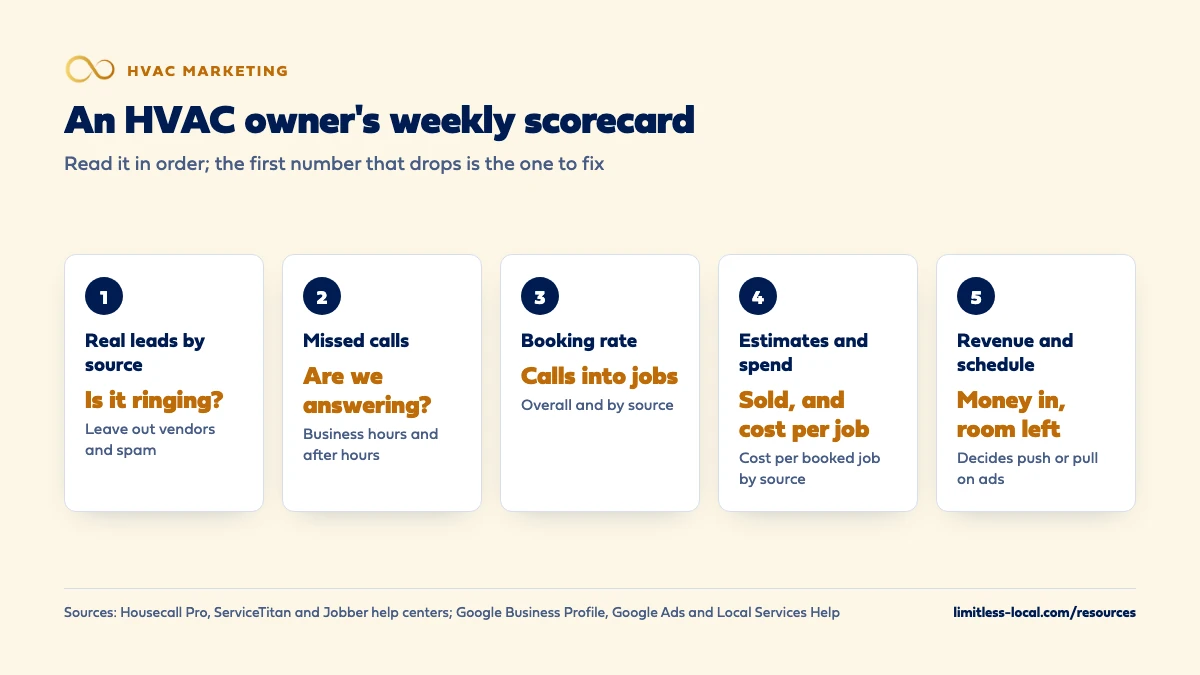
Every week, an HVAC owner should track seven numbers: real leads by source, missed calls, booking rate, estimates run and sold, marketing spend with cost per booked job, revenue by source, and how full next week’s schedule is. Together they show whether the phone is ringing, whether the office is turning calls into jobs, and whether the money going out is coming back. Read them in that order, act on the first one that drops, and save channel-by-channel decisions for the monthly review.
That’s the scorecard we build our reporting around: booked jobs and what each one cost, not clicks. Every one of our HVAC marketing packages includes a real-time dashboard and a monthly report with a cost-per-lead breakdown, plus call tracking with recording and transcription and source tagging on every lead. Our automation add-ons, including a lead tracking dashboard, plug into any tier. For how tracking fits with SEO and ads, see the HVAC marketing guide and the rest of the HVAC marketing questions library.
Why check numbers every week instead of every month?
Because in HVAC a month is a long time. A heat wave, a broken call forward or a tech out sick can cost you a dozen jobs before a monthly report even lands. A weekly check catches the problem while you can still do something about it.
The trick is keeping it short. A weekly scorecard isn’t the place to judge whether SEO is working or whether to drop a channel; one week is too small and too noisy for that. It’s a quick health check: is the phone ringing, are we answering it, are calls turning into jobs, and is the money coming back?
Seven numbers cover it. Most of them already live in your phone system, your ad accounts and your field software. The work is pulling them onto one page, the same way, at the same time each week.
Number 1: How many real leads came in, and from where?
Start with leads, split by source: Google Ads, Local Services Ads, your Google Business Profile, your website, referrals, Facebook, mail. Count calls, forms and messages together.
Count only real leads. Vendors, robocalls and wrong numbers inflate the total and make every other number look worse. Housecall Pro’s call reports, for example, separate total calls from opportunity calls, meaning customer calls that could turn into jobs, not vendors or spam. Whatever software you use, set it up to make that split.
Know what each platform is counting, too. In your Business Profile, the Calls metric is the number of times someone tapped the call button, not the number of conversations you had. If junk is swamping the real leads, what to fix when your HVAC leads are mostly junk walks through the cleanup.
Number 2: How many calls did we miss?
A missed call is a lead you paid for and never got a shot at. Track how many calls went unanswered during business hours and after hours, and how many of those you called back and reached.
Your phone system or field software should show this. ServiceTitan, for example, flags abandoned calls, which include calls nobody answered, and warns that they hurt the accuracy of your reporting because they can’t be tied to a customer or job. If nobody’s working that list each day, those callers are booking with someone else.
This is the number to watch hardest in peak season. When missed calls jump, it’s usually a staffing or routing problem, not a marketing one, and no amount of ad spend fixes it. How your HVAC office should handle incoming calls covers routing, overflow and scripts.
Number 3: What share of real leads booked?
Booking rate is booked jobs divided by real leads, for the week. It’s the single best read on how well your office turns interest into work, and it’s where a lot of HVAC revenue quietly leaks.
Track it overall and by source. A low rate on one source points to lead quality; a low rate across every source points to the phones, the script or the schedule. If one CSR books far fewer calls than another on the same mix, that’s a training conversation, and call recordings make it an easy one.
Get the definition right before you compare weeks. Calls from existing customers rescheduling a visit shouldn’t count, and neither should calls that were never leads. What percentage of calls your HVAC office should be booking covers how to set a target for your own shop.
Number 4: How many estimates did we run, and how many sold?
Replacement estimates are where the big tickets are, so give them their own line: estimates run this week, estimates sold, and the dollar value of each. A drop in estimates run tells you the replacement leads dried up. A drop in estimates sold, with the same number run, points to price, proposals or follow-up.
Remember that replacement decisions take time. An estimate run on Tuesday may sell three weeks later, so look at sold estimates against a few weeks of estimates run, not just this week’s. Most field software can report open estimates, so you can see which ones are waiting on a follow-up call.
What a good close rate looks like for HVAC replacement estimates goes deeper on reading and improving this number.
Curious what your marketing is actually booking?
Get a free visibility audit — no obligation, no sales pitch.
Number 5: What did we spend, and what did each booked job cost?
Pull this week’s spend from each paid channel and divide it by the booked jobs that channel produced. That’s your cost per booked job, by source, and it’s the number that tells you whether your marketing is working at a price you can live with.
Check what your ad platforms count, because their numbers aren’t booked jobs. In Google Ads, phone call conversions count every call that lasts at least the minimum length you set, whether or not it booked. In Local Services Ads, each lead is marked Charged, Not charged, In review or Credited, so a lead you were charged for this week may be credited later.
Don’t panic over one expensive week. Compare cost per booked job against your own ceiling, which the cost per booked call your HVAC company should aim for shows how to work out.
Number 6: How much revenue did each source bring in?
Cost per booked job tells you what you paid. Revenue by source tells you what you got. A channel that books expensive jobs can look bad on cost and still be your best money-maker.
Field software makes this easier if every job carries a lead source. Jobber’s lead source report, for example, shows leads, quotes, jobs and invoices by source, plus the value of the first invoice tied to each lead. Whatever you use, the point is to see money in next to money out.
On a weekly scorecard, a running month-to-date total by source is usually more useful than a single week, since big jobs land unevenly. Watch for a source that keeps booking jobs but never produces much revenue; it may be filling the board with small tickets.
Number 7: How full is next week's schedule?
This is the number that tells you what to do with all the others. Look at booked hours for the coming week against the hours your techs and install crews actually have.
- Nearly full: don’t raise ad budgets; you’ll pay for calls you can’t run. Push maintenance and tune-ups into later weeks.
- Half empty: it’s time for a past-customer offer, a budget increase on your best channel, or tighter follow-up on open estimates.
- Full of the wrong work: plenty of small service calls and no replacements means it’s time to look at which jobs your ads go after.
Pair it with the forecast. A heat wave or cold snap on the way changes next week’s demand faster than any marketing change you could make.

How do I set up a one-page weekly scorecard?
Keep it to one spreadsheet tab or one dashboard view, with a row per week and a column for each number:
- Real leads, by source
- Missed calls
- Booking rate
- Estimates run and sold
- Spend and cost per booked job, by source
- Revenue by source, month to date
- Next week’s schedule, as a share of capacity
Pick one person to fill it in, on the same day each week, from the same reports. Monday morning works for most shops: last week is closed and this week hasn’t started. Once it’s set up, it should take your office manager about 15 minutes.
Then spend a few minutes reading it together. A scorecard nobody discusses is just homework.
How do I read the numbers without overreacting?
Read them in order, the way a customer moves: leads, then missed calls, then booking rate, then estimates, then cost and revenue. The first number that drops is usually the one causing the rest. If leads held steady but booking rate fell, the ads aren’t the problem.
Compare each week with the last few weeks and, once you have the history, with the same week last year. HVAC swings with the weather, so a mild week will look bad next to a heat wave every time. One bad week is a question; two or three in a row is a pattern worth acting on.
And change one thing at a time. If you raise the budget, rewrite the script and switch call routing in the same week, you won’t know which change moved the numbers.
Which numbers can wait for the monthly review?
Some numbers move too slowly or too unevenly to read weekly. Save these for a monthly look:
- SEO and Maps progress: rankings and organic calls build over months.
- Reviews: how many new ones, and the average rating.
- Profit by channel: revenue minus job costs and marketing, once invoices are closed.
- Maintenance plan members: new sign-ups, renewals and cancellations.
- Channel decisions: whether to grow, shrink or drop a source.
The monthly review is where you decide where next month’s money goes; the weekly scorecard is where you catch problems before they cost you the month. Tracking whether your HVAC marketing is paying off covers the monthly side and the tracking setup behind both.
Not sure which of these is costing you jobs?
A free visibility audit checks the Google profile, reviews, site and tracking, and shows what to fix first.
What's different about tracking numbers for an HVAC company
The weather moves every number. Lead counts, booking rates and costs all swing with heat waves and cold snaps. Note the weather on your scorecard each week so you compare like with like.
Repairs and replacements need separate lines. A week of 40 small service calls and a week with two system replacements can bring in similar money. Split estimates and revenue by job type so one doesn’t hide the other.
Members distort the lead count. Maintenance plan visits and calls from existing members aren’t new marketing leads. Count them separately, or your marketing will look better than it is in spring and fall.
A worked example: two weeks on one scorecard
These numbers are made up to show how to read a scorecard, not a benchmark for your market.
Week one: 58 calls and forms, 44 of them real leads. 29 booked, a booking rate of about 66%. Marketing spend was $2,100, so each booked job cost about $72. Revenue booked from new jobs, month to date: $21,400.
Week two: 61 calls and forms, 46 real leads, about the same as week one. But only 23 booked, a booking rate of 50%, and with spend at $2,150, each booked job cost about $93.
Leads held steady, so the ads didn’t break. Reading in order, the next number is missed calls, and there it is: 11 missed in week two, most during a two-day stretch when the office was short-staffed. The fix is coverage on the phones, not more ad spend. A free visibility audit checks whether your tracking can show you this kind of drop in the first place.
Frequently asked questions
What's the single most important weekly number for an HVAC company?
If you only track one, make it booked jobs by source. It shows whether the phone is ringing and whether the office is turning calls into work, in one number.
Should I track cost per lead or cost per booked job?
Cost per booked job. Cost per lead counts calls that never turn into work, so a channel can look cheap per lead and still be expensive per job.
Who should fill in the weekly scorecard?
Whoever already runs the office reports, usually the office manager or dispatcher. The owner’s job is to read it, ask why, and decide what changes.
What if my software doesn't track lead sources?
Start by asking every caller how they heard about you and logging it on the job. Add a separate tracking number for each paid channel as soon as you can, so you’re not relying on memory.
Do I need to track return on ad spend every week?
Not weekly. Revenue from replacements lands unevenly, so return on ad spend is clearer over a month or a season. Weekly, cost per booked job and revenue month to date are enough.
How long before my weekly numbers mean something?
Give it a few weeks to settle on definitions and catch tracking gaps. After a couple of months you’ll have enough history to spot a real drop from a normal swing.
Key takeaways
- Seven weekly numbers: real leads by source, missed calls, booking rate, estimates, cost per booked job, revenue by source, and next week’s schedule.
- Count only real leads, and know what each platform’s ‘call’ or ‘conversion’ actually counts.
- Read the numbers in the order a customer moves; the first one that drops is usually the cause.
- Let next week’s schedule decide whether to push or pull ad spend.
- Keep channel decisions, SEO progress and profit for the monthly review.
Want a second set of eyes on your setup?
We'll look at how you show up locally and where calls are leaking, then send you a plain-English breakdown.
More in this section
- How much time should an HVAC owner spend on marketing each week?
- How do I track whether my HVAC marketing is paying off?
- What percentage of calls should my HVAC office be booking?
- How do I keep HVAC calls coming in during slow months?
- How many booked calls does my HVAC company need to hit its goal?
Sources
- Conversion Rate Reporting — Housecall Pro Help Center
- Understand call classifications — ServiceTitan Help Center
- Understand your Business Profile performance & insights — Google Business Profile Help
- About phone call conversion tracking — Google Ads Help
- About Automated Local Services Ads lead credits — Google Local Services Help
- Lead Source Report — Jobber Help Center